The Density of Minerals
In this lab, you will use water to help you measure the density of minerals. Student groups 2-3 students max. One lab must be handed in for each group with the names of each member.
Problem
How can you compare the density of different minerals?
Materials
graduated cylinder, 100 mL
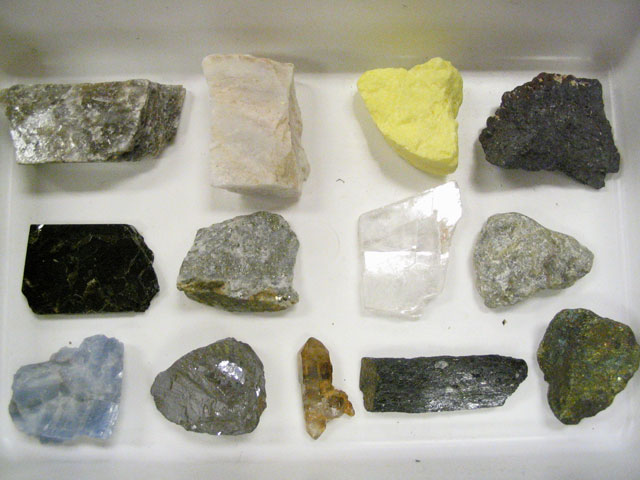
mineral samples
water
balance or scale
overflow can
string
Procedure
1. Create a data table titled "Mineral Density". Create columns for Mass (g), Volume (cm3) and Density (g/cm3). Create a row for each mineral. Place the first mineral on the balance and record its mass in the data table.
2. Tie a string around the mineral.
3. Place the overflow can on a stack of books so that the spout can drain into the graduated cylinder.
4. Close the spout with your finger, fill the can with water, remove your finger and let the excess water flow into the graduated cylinder. Discard this overflow water.
5. Place graduated cylinder back under spout. Carefully lower the mineral into the can until it is totally underwater. When all of the excess water has drained into the graduated cylinder record this volume in your data table.
7. Calculate the density of the mineral by using this formula.
Density = Mass of mineral/ Volume of water displaced by the mineral
(Note: Density is expressed as g/cm3. One mL of water has a volume of 1 cm3.)
8. Repeat steps 2–8 for the remaining samples. Compile class data on front marker board.
9. Construct a histogram (bar graph) showing the data for your whole class for each mineral. The y axis should be labeled "Number of Students" and the x axis should be labeled "Density of Mineral X." Analyze the results from each mineral test by looking at your graphs. Not all of the results will be consistent, what value was most often found for the density of each mineral?
10. Hand in your histograms and the best answer for each density on the bottom of the sheet of paper that you put your data tables on. Staple all together.
Comments (0)
You don't have permission to comment on this page.